

Overview
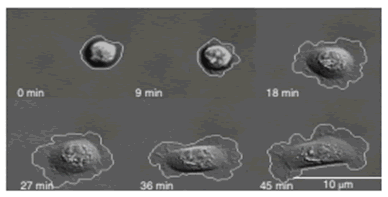
Phenotypic (cellular and morphologic) biomarkers are measured via sequential live-cell imaging and fixed-cell imaging in a microfluidic environment. Representative live-cell biomarkers include cell spreading and tortuosity, cell adhesion rate to the device substrate, cell area change during adhesion, and tortuosity of cell membrane as a measure of morphology.
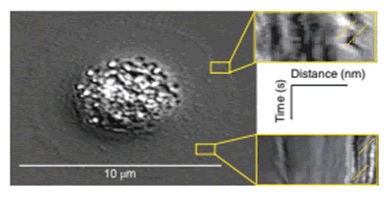
Objective assessment of dynamics of the cell membrane surface are measured as retrograde flow through kymographs.
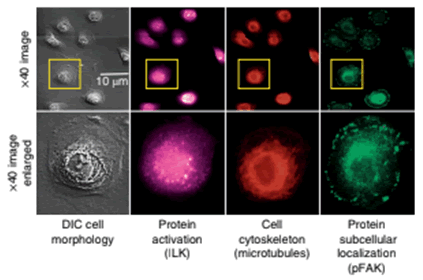
The boxes in yellow indicate examples of where the retrograde flow measurements are made for cells being evaluated. The expression, localization and phosphorylation state of subcellular protein complexes (phospho-focal adhesion kinase, pFAK) and individual proteins (integrin-linked kinase, ILK) as well as microtubules are measured on corresponding fixed cells and matched to corresponding live-cell images.
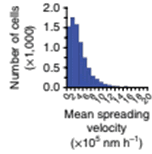
Quantification of the total cell population for mean cell-spreading velocity is analyzed
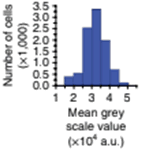
Mean greyscale values are quantified to objectively assess changes
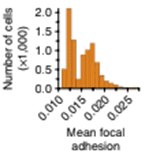
Mean cell focal adhesion (FA) intensity is quantified
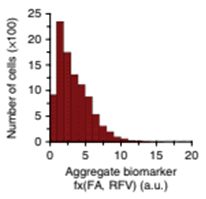
Aggregate phenotypic biomarkers are analysed to assess local adverse pathology potential (LAPP)
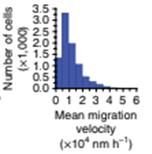
Mean cell-migration velocity is quantified for number of cells in the field
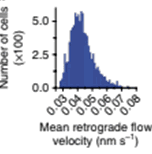
Mean actin-retrograde-flow velocity (RFV) is assessed for tumor cells
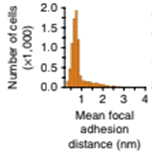
Mean cell focal adhesion (FA) distance from the edge of cell membrane is quantified
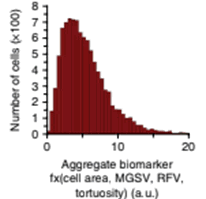
Metastatic adverse pathology potential (MAPP) is estimated as an aggregate phenotypic biomarker
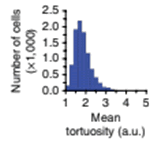
Mean cell tortuosity is estimated for the number of cells in field of view
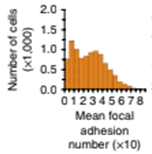
Mean cell focal adhesion (FA) is estimated for the cells
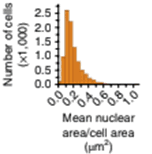
Mean cell nuclear area/cell area is quantified for the cells in the field of view
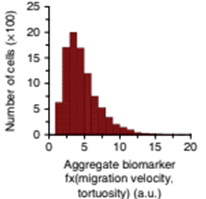
Metastatic adverse pathology potential (MAPP) is estimated as aggregate biormarker evaluating cell migration velocity and tortuosity
Key Stakeholder Benefits
Patients
Increased confidence in shared decision-making on staging or treatment action plans for various types of solid tumors. Up to forty percent of men with positive prostate biopsies are diagnosed with low or intermediate risk prostate cancer (Gleason Score 6 or 7) and face a difficult treatment action choice with their clinician i.e. whether to begin treatment or maintain active surveillance. While some of these prostate tumors may remain indolent, some are in fact aggressive. Stratification of the tumor aggressiveness risk is currently imprecise. Cellanyx is developing a phenotypic laboratory-developed test (LDT), which augments the pathologic grading based on analyzing live tumor single cell behavior, with potential to aid shared decision-making.
Clinicians
Cellanyx is augmenting standard pathology with a novel Laboratory Developed Test based on live single tumor cell phenotypic analysis to improve risk stratification of tumor aggressiveness. This first-in-class live tumor cell phenotypic test is designed to provide actionable information on cancer cell aggressiveness to support shared clinical decision-making.
This novel live-cell phenotypic test platform provides unique, and previously inaccessible, cellular and molecular biomarker information to assess temporal and spatial cellular and subcellular features that predict pathobiological behavior and adverse pathology. The phenotypic biomarkers measured using the LPCP (Popup: Live primary cell phenotypic) test resulted in statistically significant predictions of P-SAP (Post-Surgical Adverse Pathology) features in RP (Radical Prostatectomy) specimens. The LPCP test, as a member of a new class of diagnostic/prognostic tests, generated clinically predictive scores:
LAPP (Local Adverse Pathology Potential), and MAPP (Metastatic Adverse Pathology Potential), for the RS (Risk Stratification) of PCa (Prostate Cancer), and has the potential to improve personalized prognosis and treatment guidance in men with newly diagnosed prostate cancer.
Third-Party Payors
Reduction in unnecessary treatment costs associated with surgeries or radiation for low-to-intermediate grade tumors. Historically, Gleason score 7 (GS) for Prostate Cancer (PCa) is the most common PCa diagnosis, followed by GS 6 (49% of cases). In a recent study of >1800 PCa patients, 39% were diagnosed as GS 7. A study of 320 GS 7 patients published in 2006 found that 75% of these GS 7 patients had the less aggressive form of cancer and were classified as (3 + 4) instead of (4 + 3) post-radical prostatectomy. These 75% of the patients were overtreated and added to the overall cost of healthcare for radical prostatectomy and/or radiation therapies. Improved risk stratification (RS) of GS 6 and 7 by differentiating indolent from aggressive GS 6 and GS 7 cancers may reduce rates of patients needing over-treatment substantially.
Investors
First-in-class, clinically-proven, patented, scalable and portable machine-vision and AI-driven phenotypic cancer risk stratification test to improve actionability and outcomes. The risk stratification of prostate cancer and breast cancer tumors from patients relies on histopathology, selective genomic testing, or on other methods employing fixed formalin tissue samples. However, static biomarker measurements from bulk fixed-tissue samples provide limited accuracy and actionability. Cellanyx has developed a live-primary-cell phenotypic-biomarker assay with single-cell resolution, and its validation with prostate cancer and breast cancer tissue samples for the prediction of post-surgical adverse pathology. These tests have demonstrated clinical proof-of-concept in prostate and breast cancer patients which represents a potential to disrupt 35% (Popup: link to cancer.gov statistics page https://www.cancer.gov/about-cancer/understanding/statistics) of cancer market to improve actionability and treatment outcomes.